What we found
- Saturday is the quietest day for 21 of the 22 topics (Boredom is the exception). On the median topic, a Saturday gets 16% fewer views than an average day, and a Tuesday gets 8% more.
- The week starts strong. Monday or Tuesday is the busiest day for 19 of the 22 topics. The Pomodoro Technique article gets 48% more views on a typical Tuesday than on a typical Saturday.
- January and February are the busy months. They are the peak month for 17 of the 21 topics with enough history, and July or December is the low point for 15. The Pomodoro Technique gets 47% more views in January than in July. Study skills peaks in February, at 32% above its average month.
- General productivity topics are being read far less. From 2016 to 2025, typical daily views fell 72% for Procrastination, 79% for Motivation and 69% for Time management, while English Wikipedia as a whole fell 8%. 16 of the 21 topics with a full history fell more than the site did.
- The ADHD-adjacent terms went the other way. Executive dysfunction is up 112% and Hyperfocus 19% over the same years.
Wikipedia views are not Google searches, so read these as "when people go and read about a topic", not "how many people have the problem". The limits section says what this data can and can't tell you.
Which day of the week people read about productivity
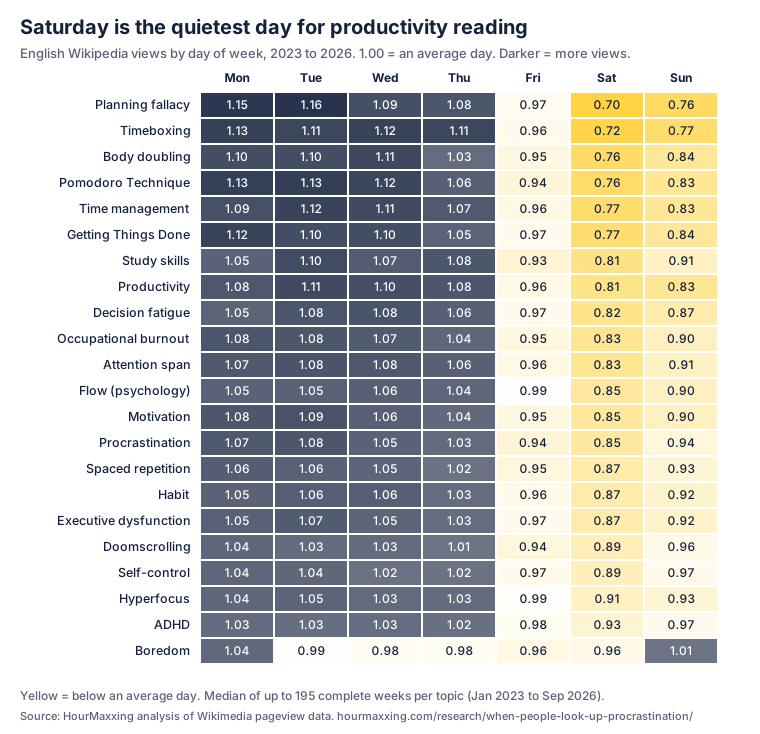
The pattern looks like a working week. Reading is highest Monday to Wednesday, eases on Thursday, slips on Friday and bottoms out on Saturday, then recovers part of the way on Sunday. The work methods swing the most: Planning fallacy, Timeboxing, Body doubling, the Pomodoro Technique, Time management and Getting Things Done all lose about a quarter of their views on a Saturday. ADHD and Hyperfocus barely move. Our guess is that people read about those because of how their days go in general, not because of a task due on Monday.
Boredom is the odd one out. Its views are close to flat all week, and Sunday is slightly above average.
If you plan around this: the Sunday lift may mean a lot of people already think about the coming week on Sunday, which makes it a natural slot for a short weekly review. Our weekly review guide has a 30-minute checklist and a free template, and the time blocking guide has a 15-minute version tied to its weekly planner.
Which months people read about productivity
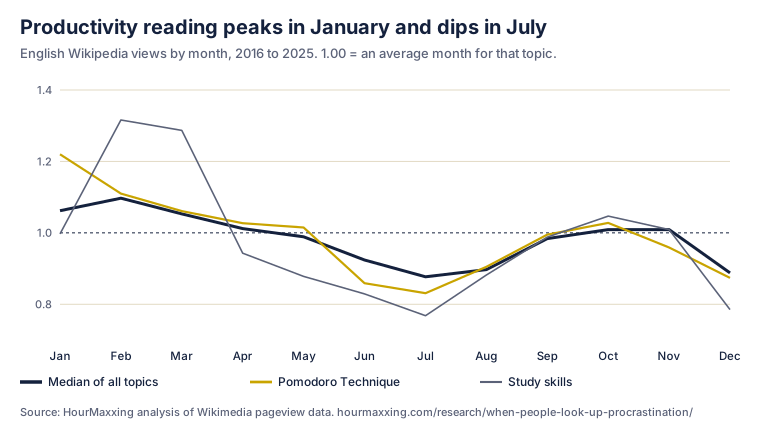
Reading peaks in January and February, sags through the summer to a low in July, comes back in September and October, and drops again in December. It looks more like the northern-hemisphere school year than like New Year's resolutions, since February beats January. Study skills, the most school-shaped topic, has the biggest February peak and one of the deepest summer dips. The Pomodoro Technique, a favourite study method, has the strongest January.
If you're a teacher or run a study support service, the start of the spring term is when these topics have the most readers. The studying guide and the Pomodoro guide are written for that crowd.
Which topics people read less, and more, than in 2016
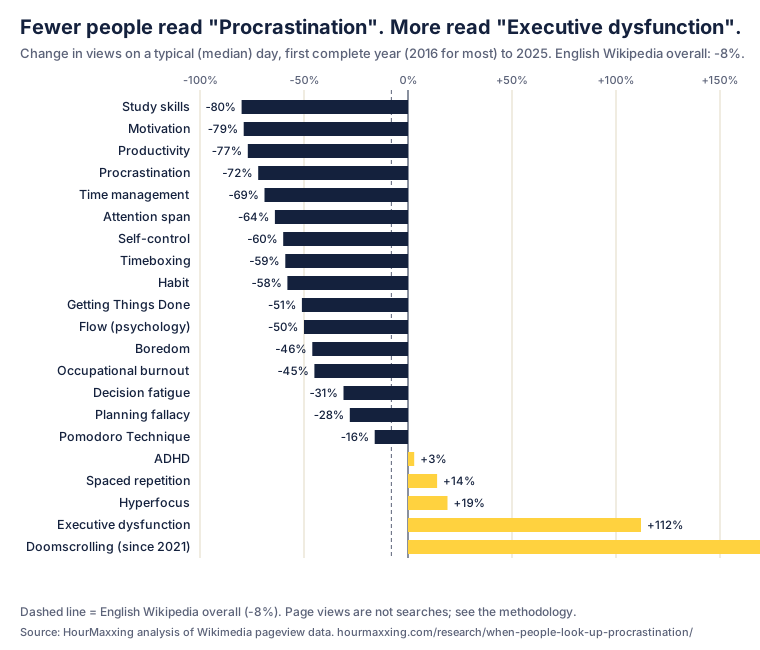
Almost every general productivity article lost most of its readers. That's far beyond the -8% drop for Wikipedia as a whole, so it isn't only fewer people using Wikipedia. This data can't say why. One likely part of it is that search engines now answer "what is procrastination" on the results page, so fewer people click through to an encyclopedia. The people who still click may be the ones who want more depth.
The topics that grew are the ones that describe how a particular brain works: Executive dysfunction more than doubled and Hyperfocus rose 19%. Doomscrolling, which only shows up in the data from August 2020, kept climbing after its first full year. Readers seem to have shifted from "how do I get more done" to "why does my attention work like this".
Our guides on hyperfocus, procrastination and doomscrolling cover the practical side of those topics.
All 22 topics
| Wikipedia article | Views per day (last 12 months) | Saturday vs average day | Busiest month | Change since 2016 |
|---|---|---|---|---|
| ADHD | 3,988 | -7% | March | +3% |
| Pomodoro Technique | 1,451 | -24% | January | -16% |
| Flow (psychology) | 902 | -15% | January | -50% |
| Doomscrolling | 804 | -11% | October | +212% (since 2021) |
| Executive dysfunction | 526 | -13% | November | +112% |
| Motivation | 395 | -15% | March | -79% |
| Spaced repetition | 391 | -13% | January | +14% |
| Procrastination | 376 | -15% | January | -72% |
| Occupational burnout | 342 | -17% | January | -45% |
| Getting Things Done | 335 | -23% | January | -51% |
| Time management | 323 | -23% | February | -69% |
| Boredom | 307 | -4% | January | -46% |
| Hyperfocus | 203 | -9% | January | +19% |
| Body doubling | 175 | -24% | not enough data | not enough data |
| Productivity | 157 | -19% | February | -77% |
| Self-control | 153 | -11% | February | -60% |
| Habit | 149 | -13% | February | -58% |
| Decision fatigue | 110 | -18% | February | -31% |
| Planning fallacy | 103 | -30% | February | -28% |
| Attention span | 98 | -17% | February | -64% |
| Study skills | 90 | -19% | February | -80% |
| Timeboxing | 73 | -28% | February | -59% |
Views per day is the average from October 2025 to September 2026. "Change since 2016" compares a typical (median) day in the first full year with a typical day in 2025.
Download the data
- summary.csv: one row per topic with the day-of-week index, month-of-year index, typical daily views in the first year and in 2025, the change, and English Wikipedia's change over the same years.
- daily.csv (3.8 MB): every daily view count we used, 22 articles from 2016-01-01 to 2026-09-30.
Our tables and charts are free to reuse under CC BY 4.0. Credit "HourMaxxing" with a link to this page. The underlying pageview counts come from the Wikimedia Foundation and are free to use.
Method
- Source. The Wikimedia Analytics API, daily per-article pageviews for English Wikipedia, all platforms (desktop, mobile web and the apps), with the agent filter set to "user". That filter leaves out known crawlers and traffic Wikimedia flags as automated. We pulled the data on October 27, 2026.
- Topics. twenty-two articles that match what our guides cover: focus, time, tasks, habits, studying, phone use and ADHD. We picked them before looking at the results, and we only used each article's current title (no redirects).
- Day of week. For every complete Monday to Sunday week from January 2, 2023 to September 27, 2026 (up to 195 weeks), each day's share of that week's views, times seven. Then the median across weeks, so one viral day can't move the result. Using shares within a week removes long-term growth or decline.
- Month of year. For each complete year from 2016 to 2025, the month's average daily views divided by the year's average. Then the median across years. Topics with fewer than three complete years (Body doubling) get no month figure.
- Long-term change. Median daily views in 2025 compared with the first complete year of data (2016 for all but Doomscrolling, which starts in 2021). We used the median day because single spikes are common. The Flow article, for example, had about ten times its usual traffic in January 2018. The Wikipedia-wide comparison uses average monthly views for all of English Wikipedia with the same filter.
- Code. One Python script with no third-party packages does the fetching, the maths, the CSVs and the charts: wikipedia_pageviews.py. Run it to check our numbers or update them.
Limits
- A page view is someone opening an article, not someone searching. People who need help with procrastination often go straight to YouTube, TikTok, Reddit or a chatbot and never open Wikipedia.
- English Wikipedia readers are global. Weekday patterns mix time zones, and the summer dip reflects the northern hemisphere, where most English-language readers live.
- Automated traffic that Wikimedia doesn't catch still gets counted, and Wikimedia has changed how it classifies traffic over the years. That matters most for the long-term change figures. The day-of-week figures compare days within the same week, so they're the least affected.
- Articles get rewritten, split and renamed. A sharp one-month change (Motivation dropped by about half in June 2025) can come from the page itself, not the readers.
- We report what happened, not why. Where we suggest a reason, we say it's a guess.
Sources
- Wikimedia Foundation. Analytics API: page views reference. doc.wikimedia.org
- Wikimedia Foundation. Research: Page view (definition of a page view and of agent types). meta.wikimedia.org
- Wikimedia Foundation. Analytics/AQS/Pageviews (API notes). wikitech.wikimedia.org
Using this in an article or a class? We'd like to hear about it: hello@hourmaxxing.com. New here? Start with the reading order →